Continuous Uniform Transform1
Introduction
Transform units serve two functions. Their primary function is to adapt the output from
a driver unit to whaterver range is appropriate to a specific application. Their secondary
function is to influence how values concentrate within various regions of the application range.
The ContinuousUniform transform is what you want
when range-adaptation is the sole concern, and when you're content to allow whatever distribution
the driver values already have to pass through with just rescaling.
The range of values output by ContinuousUniform.convert() is
controlled by two parameters implemented as Java fields: minRange and
maxRange. These have the restriction that
minRange < maxRange.
The convert() method maps a value x
in the driver domain from zero to unity into a value v in the application-range
from minRange to maxRange using the
linear interpolation
formula:
v = (maxRange-minRange)*x + minRange;
Profile
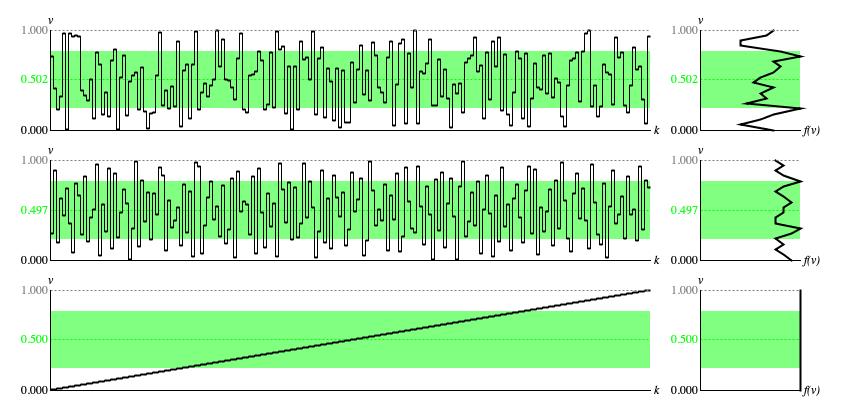
Figure 1 illustrates the influence (or more properly lack of influence) which
ContinuousUniform.convert() exerts over
driver sequences. The vertical v axis shows the application range, which in this particular instance happens to
match the driver range from zero to unity. The horizontal k axis shows the sample values
vk which have been obtained
from driver values xk using
convert(). All three
source sequences are nominally uniform. Each left-side sample graph presents 200 values; the right-side
histogram divides the application range into 20 equal-sized regions. Ideally, this would result in 10 samples
per histogram region, but this happens exactly only in the bottom row of graphs.

Figure 1: Panel of
ContinuousUniform output from three different
Driver sources. Each row of graphs provides a time-series graph of samples (left)
and a histogram analyzed from the same samples (right).
The first row of graphs was generated using the standard random number generator. The second
row was generated using the balanced-bit generator. The third row was generated using an ascending sequence of driver values,
equally spaced from zero to unity.
The standard random number generator's uniformity manifests only over the long term; its concern for the independence of consecutive samples works against short-term uniformity. The standard-randomness histogram appearing in the top row of Figure 1 is hardly uniform, though the white space separating the vertical v axis from the smallest f(v) value is about the same as the horizontal distance separating the smallest f(v) value from the largest f(v) value. Besides, no other distribution suggests itself.
The balanced-bit generator (middle row of Figure 1) actively strives for uniformity over the short term. The balanced-bit histogram appearing in Figure 1 has half again the distance from the smallest f(v) value to the largest f(v) value.
There is no surer way of obtaining uniform driver values than to calculate an increment
Δx = 1/N, where N is the number of samples.
The first sample value x0 is set to Δx/2;
subsequent values are calculated as xk = xk-1 + Δx
until xk threatens to exceed unity. With driver values generated in this manner,
the graphs in the bottom row of Figure 1 come to resemble two essential functions describing the Transform
unit's underlying statistical distribution:
The time-series graph of samples comes to resemble the distribution's
percentile function, which for a continuous uniform distribution is an upward sloping line. The
histogram of sample values comes to resemble the distribution's probability density function, which for a
continuous uniform distribution is constant.
For each graph in Figure 1 the average sample value is plotted as a dashed green line, while the interval between ± one standard deviation around the average is filled in with a lighter green background. For the ideally uniform driver values plotted in the third row of graphs, the average sample value is 0.5 and the standard deviation is 0.289. The interval from 0.5-0.289 to 0.5+0.289 is 2*0.289 = 0.58 = 58% of the full application range from zero to unity; since sequence is uniform and the transform passes this uniformity along, we can assert that 58% of samples fall within the green-shaded part of the graph, giving a concentration rate of 58/58 = 1.00.
Coding
ContinuousUniform implementation class.
Not really much to see here.
The type hierarchy for ContinuousUniform is:
-
TransformBase<T extends Number> extends WriteableEntity implements Transform<T> -
ContinuousDistributionTransform extends TransformBase<Double> implements Transform.Continuous -
BoundedTransform extends ContinuousDistributionTransform -
ContinuousUniform
                  extends BoundedTransform
The range-bound parameters minRange and maxRange
are maintained by BoundedTransform. The calculations
required to map values from the driver domain (zero to unity) to the application range are
handled by the interpolate() method, which is
also implemented by BoundedTransform. For the
record, although BoundedTransform subclasses
ContinuousDistributionTransform, no functionality
from ContinuousDistributionTransform is actually
employed.
Comments
- The present text is adapted from my Leonardo Music Journal article from 1991, "A Catalog of Statistical Distributions". The heading is "Continuous Uniform", p. 62.
| © Charles Ames | Page created: 2022-08-29 | Last updated: 2022-08-29 |