Articulated Proximity: Baker1
Introduction
The Baker driver implements an algorithm that decides for each bit whether
to retain the set/clear state from the previous sample value or to toss a coin. The decision is effected by a
random trial based on a retention rate (proportion of retained versus reselected bits).
The backstory behind the Baker driver is embarrasing.
Other drivers concerned with distances between consecutive samples include the
Brownian driver
and with others which are obviated by Brownian.
Profile
Figure 1 (a) illustrates five examples of Baker
output with a sequence of 200 samples generated. All five examples were generated using a random seed of 1, an initial value of
0.5, and a rolloff parameter of 1.5. The only difference is the
retention parameter, which varies as indicated.
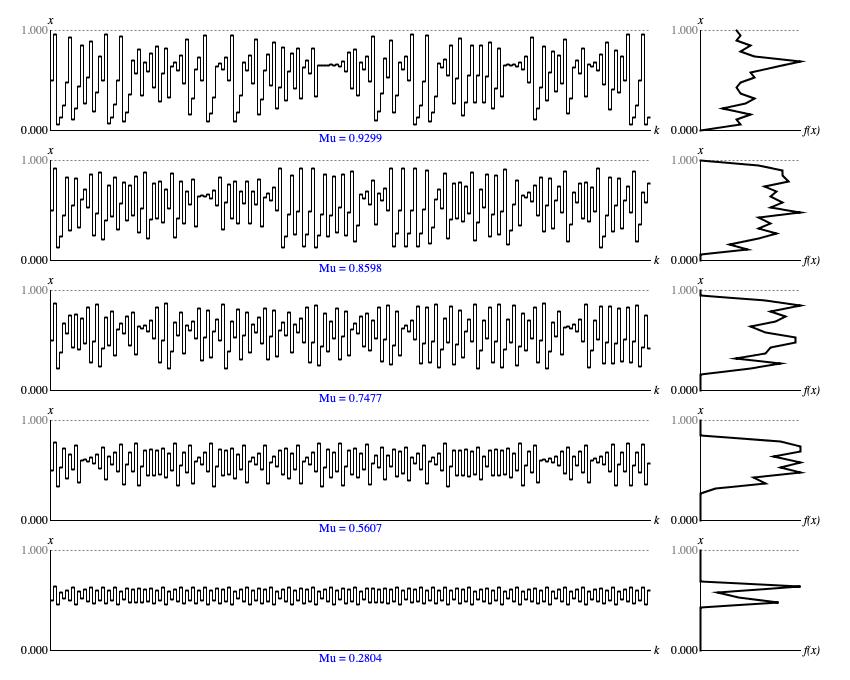
Figure 1: Sample output from
Baker.next() with
representative retention settings. The left
graph in each row displays samples in time-series while the right graph in the same row presents a histogram analyzed from the same samples.
The vertical x axes for the two graphs in each row represent the driver domain from zero to unity; the horizontal k axis of the time-series graph (left) plots ordinal sequence numbers; the horizontal f(x) axis of the histogram (right) plots the relative concentration of samples at each point in the driver domain.
The most characteristic of the sequences in Figure 1 is the first, which has samples clustering in various regions of the driver domain.
As the retention parameter dials down to zero, the behavior comes to resemble uniform randomness (i.e., that produced by
Lehmer).
Transitions
Figures 3 (a) through 3 (e) plot the range of sample-to-sample differences along the vertical Δx axis against the relative concentrations of these values along the horizontal f(Δx) axis.
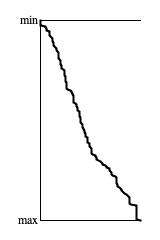
Figure 4: Divergence of 4-nibble pattern counts from
Baker.next() with
mu μ=3.9299 after 10,000 samples per pattern.
Independence
Figure 4 presents a trend graph of histogram tallies for 4-nibble patterns generated using
Brownian.next(). My analysis program decided to exclude low-frequency
patterns by limiting the graph to all but the 200 largest tallies. The most frequent patterns were:
| 15 | 1 | 3 | 6 |
| 12 | 6 | 12 | 6 |
| 13 | 5 | 10 | 10 |
| 15 | 1 | 21 | 4 |
All four of these patterns had presence tallies of between 1% and 2%. The most frequent pattern had a tally 3% larger than the next three, which were within 0.01% of one another. (These features are actually visible on the graph.)
The conclusion from Figure 4 is that the Brownian driver
fails the 4-nibble independence test.
Baker implementation class.
Coding
The type hierarchy for Baker is:
-
DriverBase
                  extends WriteableEntity
implements Driver -
Baker
                  extends DriverBase
Listing 1 provides the source code for the Baker
class. The sequential process described at the top of this page is implemented by
generate(), which is not public facing. Instead,
generate() is
called by DriverBase.next().
DriverBase.next() also
takes care to store the new sample in the field
DriverBase.value, where
generate() can employ
DriverBase.getValue() to pick this
(now previous) sample up for the next sample iteration.
DriverBase also offers
setValue() and randomizeValue()
methods to establish the initial sequence value.
Comments
- The present text is adapted from my Leonardo Music Journal article from 1992, "A Catalog of Sequence Generators". The heading is "Baker Motion", p. 62.
| © Charles Ames | Page created: 2022-08-29 | Last updated: 2022-08-30 |