2nd Order Butterworth Low-Pass Filter
|

|
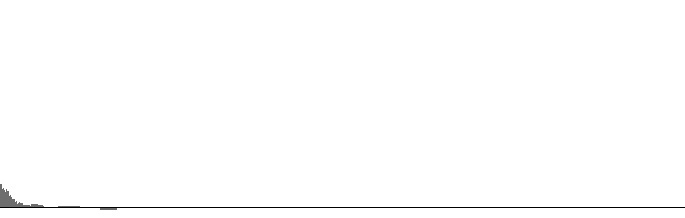
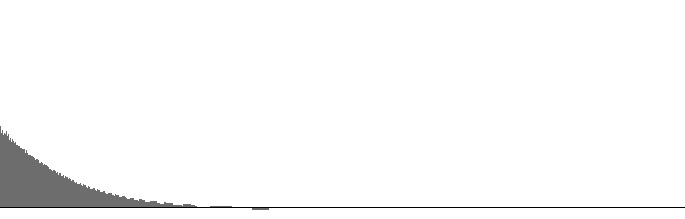
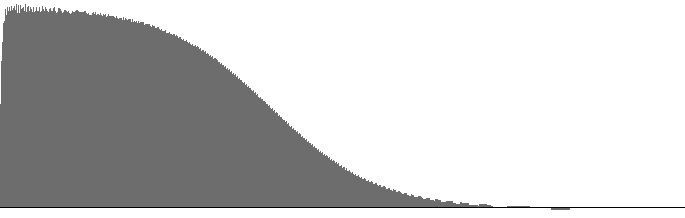
| Figure 1 (a): FilterLowPass2 amplitude versus log(frequency) with 6 Hz. “cutoff”. | Figure 1 (b): FilterLowPass2 log(amplitude) versus log(frequency) with 6 Hz. “cutoff”. |
|

|
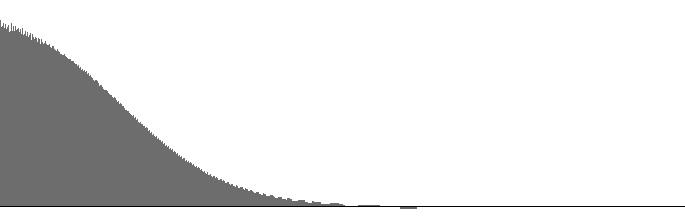
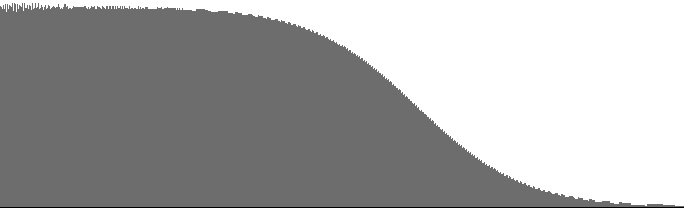
| Figure 2 (a): FilterLowPass2 amplitude versus log(frequency) with 25 Hz. “cutoff”. | Figure 2 (b): FilterLowPass2 log(amplitude) versus log(frequency) with 25 Hz. “cutoff”. |
|
|
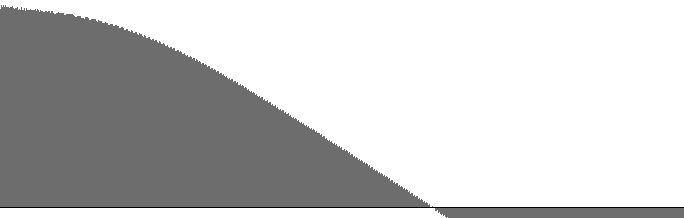
| Figure 3 (a): FilterLowPass2 amplitude versus log(frequency) with 100 Hz. “cutoff”. | Figure 3 (b): FilterLowPass2 log(amplitude) versus log(frequency) with 100 Hz. “cutoff”. |
|

|
| Figure 4 (a): FilterLowPass2 amplitude versus log(frequency) with 400 Hz. “cutoff”. | Figure 4 (b): FilterLowPass2 log(amplitude) versus log(frequency) with 400 Hz. “cutoff”. |
|

|
| Figure 5 (a): FilterLowPass2 amplitude versus log(frequency) with 1600 Hz. “cutoff”. | Figure 5 (b): FilterLowPass2 log(amplitude) versus log(frequency) with 1600 Hz. “cutoff”. |
The FilterLowPass2 unit implements the 2nd-order Butterworth low-pass filter described by Victor Lazzarini on page 484 of The Audio Programming Book. Figures 1 (a) through 5 (b) plot frequency responses for this unit.
The dropoff rate in decibels per octave is discernable as the slope in the (b) graphs. The steepest dropoff rate is around -2.9 dB per octave; however, notice that this slope appears in all (b) graphs.
One might expect the slope of the (b) graphs to decrease as the cutoff frequency increases, but this is not the case. Rather, there is a region of flat response which first becomes apparent above 25 Hz. and which expands rightward as the cutoff frequency increases. This is in fact the behavior normally expected of a low-pass filter
At 25 Hz. bandwidth, the dropoff rate is slightly more gradual than for “pink” or “(1/f)” noise, as described in Wikipedia.
For bandwidths narrower than 25 Hz., differences between frequency-response curves are mostly a matter of gain. Bandwidths narrower than 25 Hz. are therefore not recommended.
| © Charles Ames | Page created: 2014-02-20 | Last updated: 2015-07-12 |