2nd Order Butterworth Band-Pass Filter
|

|
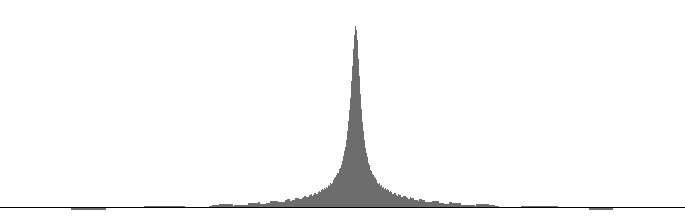
| Figure 1 (a): FilterBandPass2B amplitude versus log(frequency) with 440 Hz peak frequency and 6 Hz. bandwidth. | Figure 1 (b): FilterBandPass2B log(amplitude) versus log(frequency) with 440 Hz peak frequency and 6 Hz. bandwidth. |

|

|
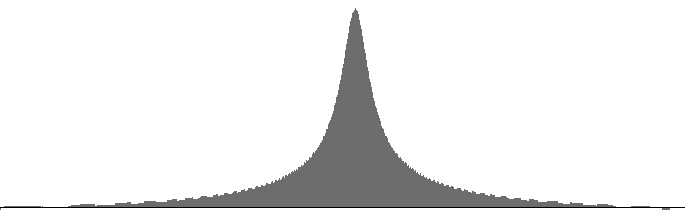
| Figure 2 (a): FilterBandPass2B amplitude versus log(frequency) with 440 Hz peak frequency and 25 Hz. bandwidth. | Figure 2 (b): FilterBandPass2B log(amplitude) versus log(frequency) with 440 Hz peak frequency and 25 Hz. bandwidth. |
|
|
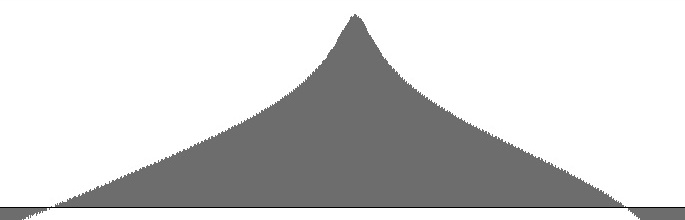
| Figure 3 (a): FilterBandPass2B amplitude versus log(frequency) with 440 Hz peak frequency and 100 Hz. bandwidth. | Figure 3 (b): FilterBandPass2B log(amplitude) versus log(frequency) with 440 Hz peak frequency and 100 Hz. bandwidth. |
|
|
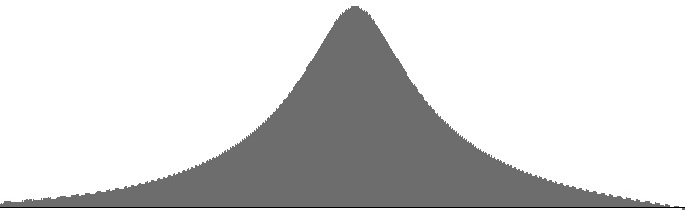
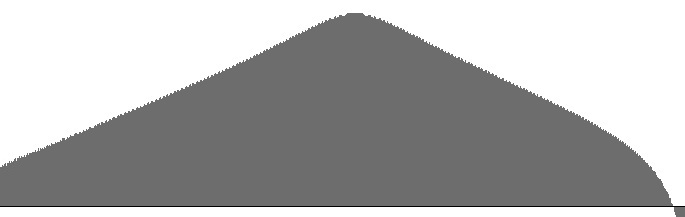
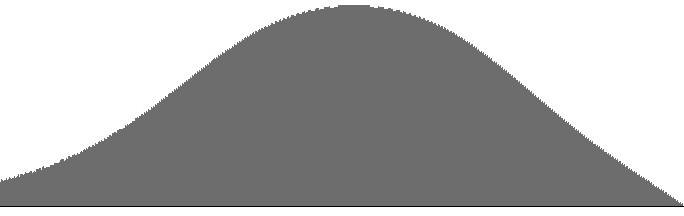
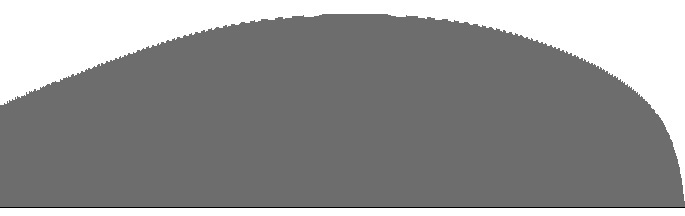
| Figure 4 (a): FilterBandPass2B amplitude versus log(frequency) with 440 Hz peak frequency and 400 Hz. bandwidth. | Figure 4 (b): FilterBandPass2B log(amplitude) versus log(frequency) with 440 Hz peak frequency and 400 Hz. bandwidth. |
|
|
| Figure 5 (a): FilterBandPass2B amplitude versus log(frequency) with 440 Hz peak frequency and 1600 Hz. bandwidth. | Figure 5 (b): FilterBandPass2B log(amplitude) versus log(frequency) with 440 Hz peak frequency and 1600 Hz. bandwidth. |
Figures 1 (a) through 5 (b) plot frequency responses for the FilterBandPass2B unit. The (a) graphs are plotted to a common vertical scale. A second vertical scale is common to the (b) graphs.
By contrast with the non-Butterworth 2nd Order Low-Pass Filter, the peaks plotted here are largely symmetrical, with very little tail on either side.
Kudos to Victor Lazzarini for publishing this excellent filter on page 484 of The Audio Programming Book.