2nd Order Low-Pass Filter
|
|
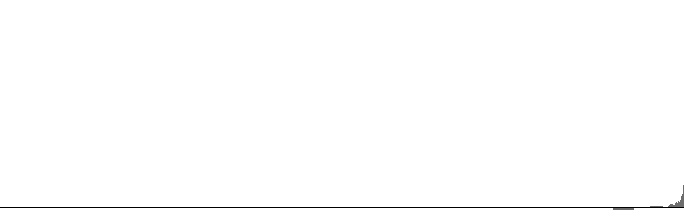
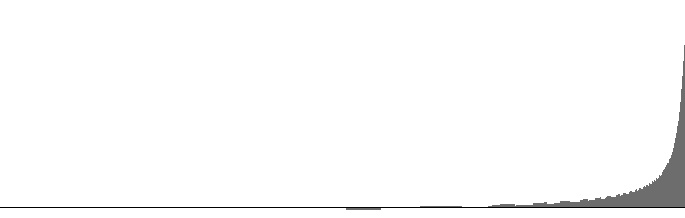
| Figure 1 (a): FilterBandPass2B amplitude versus log(frequency) with 10000 Hz peak frequency and 25 Hz. bandwidth. | Figure 1 (b): FilterBandPass2B log(amplitude) versus log(frequency) with 10000 Hz peak frequency and 25 Hz. bandwidth. |
|
|
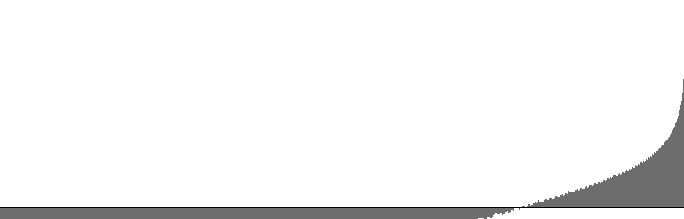
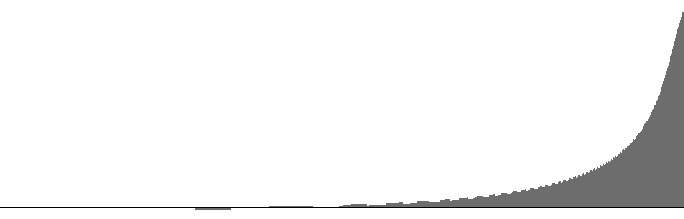
| Figure 2 (a): FilterBandPass2B amplitude versus log(frequency) with 10000 Hz peak frequency and 100 Hz. bandwidth. | Figure 2 (b): FilterBandPass2B log(amplitude) versus log(frequency) with 10000 Hz peak frequency and 100 Hz. bandwidth. |
|
|
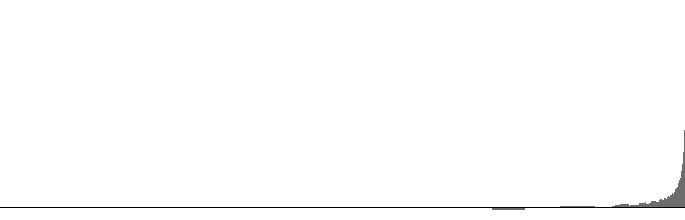
| Figure 3 (a): FilterBandPass2B amplitude versus log(frequency) with 10000 Hz peak frequency and 400 Hz. bandwidth. | Figure 3 (b): FilterBandPass2B log(amplitude) versus log(frequency) with 10000 Hz peak frequency and 400 Hz. bandwidth. |
|
|
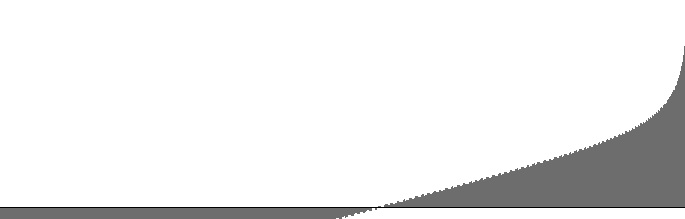
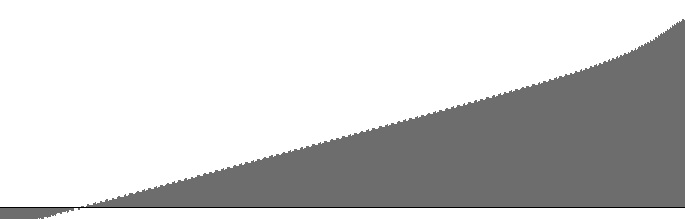
| Figure 4 (a): FilterBandPass2B amplitude versus log(frequency) with 10000 Hz peak frequency and 1600 Hz. bandwidth. | Figure 4 (b): FilterBandPass2B log(amplitude) versus log(frequency) with 10000 Hz peak frequency and 1600 Hz. bandwidth. |
|
|
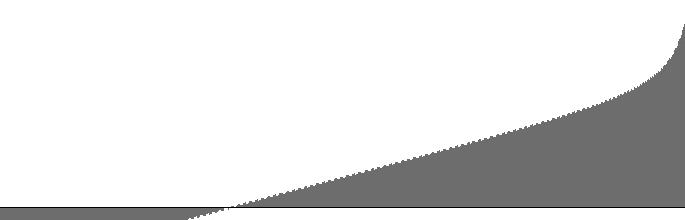
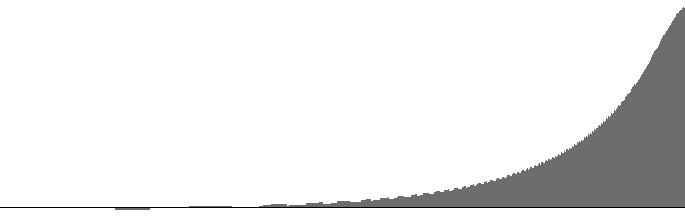
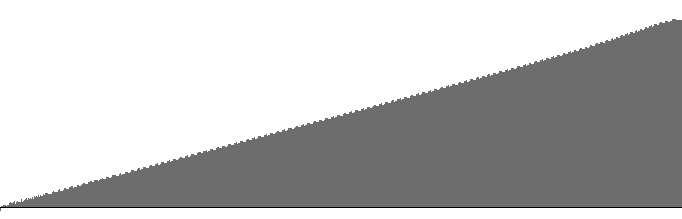
| Figure 5 (a): FilterBandPass2B amplitude versus log(frequency) with 10000 Hz peak frequency and 3200 Hz. bandwidth. | Figure 5 (b): FilterBandPass2B log(amplitude) versus log(frequency) with 10000 Hz peak frequency and 3200 Hz. bandwidth. |
Alongside the excellent 2nd Order Butterworth Band-Pass Filter that Victor Lazzarini presents on on page 484 of The Audio Programming Book, Lazzarini also presents a high-pass filter. However my attempts so far to implement this high-pass design have not produced a suitable frequency-response curve. The present study therefore employs Lazzarini's band-pass filter in high-pass mode by setting the peak frequency to the Nyquist limit of 10000 Hz.. Under this circumstance, the bandwidth input determines the lower cutoff frequency.
Figures 1 (a) through 6 (b) plot frequency responses for the FilterBandPass2B unit in high-pass mode. The dropoff rate in decibels per octave is discernable as the slope in the (b) graphs. All (b) graphs have linear regions with dropoff rates around -3.1 dB per octave. This linear region extends through the entire range when the bandwith is 3200 Hz. (16% of the sampling rate). At this bandwidth the graph closely resembles the spectrum for “blue” or “azure” noise as described in Wikipedia. Wider bandwidths cause the (b) graphs to bow in the other direction.
| © Charles Ames | Page created: 2014-02-20 | Last updated: 2015-07-12 |